Hey, it’s that guy that I am! Glad that I could offer a concrete suggestion, but I wouldn’t go so far as to call me a professional, not until I have a job doing these things at least.
Power analysis is one of those things everyone’s supposed to do but you can never quite be sure who’s doing it the right way unless you’re a grand master at the stuff, which I’m certainly not. Even my grad course in biomedical statistics didn’t do too well talking about it, and there aren’t many online resources that do a good job talking about both the theory behind power analysis and the tools that do it. That said, I think it’s always easier to do something wrong and get feedback on how to correct it than to have nothing at all and ask how to do something. So let’s see what we can get.
A basic power analysis involves four quantities:
- Effect size, aka d
- Sample size, aka n
- Significance Level: P(Type-1 error), aka α
- Power: P( Type-2 error), aka 1 - β
Two of these you’ve essentially mentioned already. I say four quantities are “involved” because this is actually a basic constraint satisfaction problem: you enter three of the given values into your power analysis calculator and it gives you the value of the fourth variable needed to meet your needs. For example, if you know the significance level, statistical power, and effect size you’re looking for, power analysis will tell you how big your sample needs to be.
Research scientists may have fancy tools at their disposal, but fortunately, the tools for doing statistics are freely available. The statistics and plotting software du jour for many labs is [R][1], which can be called and used from a command line in much the same way as Python. People who prefer a GUI to go along with it tend to use [RStudio][2]. There’s even a working R kernel for Jupyter notebooks, [IRKernel][3], which has a fairly straightforward installation process. This format should be familiar to you, since you already use IPython notebooks, and you can even display the output of both languages in the same notebook, as long as you don’t delete the output and you switch to the correct kernel before running commands. For all the stuff below, I’m just going to be copying and pasting from my terminal.
The “pwr” package is a good basic starting point for doing power analysis and performs many of the functions mentioned in [Cohen’s original 1988 paper][4] where he introduced the concept of power analysis for behavioral science. Once you have R up and running, you can install the package with one line and use another line to import the package into your current workspace.
install.packages("pwr")
library(pwr)
The last thing you need to decide is what kind of statistical test is most appropriate for your design. From a read of your post and the hypothesis you’ve put above, you’re essentially looking to see whether the mean amplitude at the entrained frequency - we’ll get to the question another time whether or not entrainment at the beat frequency is a reasonable expectation - differs between the control group and the binaural beat trial condition. Note that, of course, it isn’t the place of these statistical tests to tell you whether or not your control condition was correct - that’s a whole different area of experimental design. For these parameters, a paired two-tailed t test seems to work just fine. The point of a t test is to look for a difference in means of two sample populations. If you want to do something else, you might want to look into ANOVA, pearson correlation, or one of the other tests available with the pwr package. We use two-tailed because, presumably, you’ll consider it to be an effect if the binaural beats increase or decrease amplitude at that frequency in the EEG readout, and indeed the direction of the effect, if it exists, might differ by frequency band. We also use the paired condition because your set-up is a type of “repeated measure” on subjects in and out of the experimental condition of interest. In other words, because each subject serves as his or her own control, the “noise” factors that influence the trial condition are probably also true for the control condition. In general, this increases the statistical power of your design vs. comparing two independent populations whose noise factors are more difficult to correct for.
With that, we’re ready to start crunching some numbers for your experiment. So why don’t we start off with some back-of-the-napkin work based on the information in your post. You have two subjects in your sample, you want a significance level of .05 and β of 0.2, meaning the desired power is 0.8. Let’s see what the effect size would need to be for us to get useful results from that.
pwr.t.test(n = 2, d = NULL, sig.level = .05, power = .8, alternative = "two.sided", type = "paired")
Error in uniroot(function(d) eval(p.body) - power, c(1e-07, 10)) :
f() values at end points not of opposite sign
Well, crude. That error usually means that the expected value pwr.t.test had to return was so outside the bounds of what pwr.t.test expects that it crashed. Let’s try a slightly lower power and see if that works better.pwr.t.test(n = 2, d = NULL, sig.level = .05, power = .7, alternative = “two.sided”, type = “paired”)
 Paired t test power calculation

          n = 2
          d = 9.340765
  sig.level = 0.05
      power = 0.7
alternative = two.sided

NOTE: n is number of *pairs*
Much better, now we have some real output. You’ll notice the function returned the values I entered in the first place, but the value you want to pay attention to is effect size, d = 9.340765. In plain english, that means your experiment is underpowered unless the effect you expect to see is the mean of your trial condition is at least 9.34 times the mean of the control. I can’t really say for sure off the top of my head, but that sounds physiologically impossible.
Don’t worry about the NOTE at the end of the output, that’s just a reminder on how to interpret the n here. It’s saying we need 2 pairs of subjects, not just 2 subjects. In this case, each subject is his or her own partner, control vs. trial. I won’t paste that part in future copy-pastes.
But we already knew the study was underpowered. This function just gives us a number to put to how much of an effect we’d need to see for this to work. Let’s crunch some numbers that are a little more interesting. The biggest difference in PSD/Hz in your post seems to be around 10 Hz, where the trial condition gets to about 19 and the control looks to be 17. If we assume this to be a true effect, the effect size is about 19-17 = 2, assuming standard deviation is near 1. Given two subjects, how much power does the experiment have?
pwr.t.test(n = 2, d = 2, sig.level = .05, power = NULL, alternative = "two.sided", type = "paired")

 Paired t test power calculation

          n = 2
          d = 2
  sig.level = 0.05
      power = 0.1757074
alternative = two.sided
Well, that doesn’t bode well. The output essentially means, if we have an effect size of 2, there’s only about a 17% chance we’d detect it with this set up. All this really does is confirm your original description in the post that no significant effects were found, but it means that result could just be due to under-powering.
Without reviewing the literature on binaural beats and other calming/relaxing stimuli, it’s hard to say just what effect size we should expect. Cohen, the guy who made power analyses, stated effect sizes of 0.2, 0.5, and 0.8 correspond to low, medium, and high effect sizes, respectively, which would put the possible effect size as very high, but Cohen was speaking in terms of social sciences, which may not be appropriate here. Just out of curiosity, we can ask how many subjects would we need to run to be certain (sig level = .05, power = 0.8) that and effect size of 2 this is real?
pwr.t.test(n = NULL, d = 2, sig.level = .05, power = .8, alternative = "two.sided", type = "paired")

 Paired t test power calculation

          n = 4.220731
          d = 2
  sig.level = 0.05
      power = 0.8
alternative = two.sided
Fancy that. Assuming seeing a simple difference in mean value at the peak is what you’re after, you should be able to detect an effect pretty easily, if it exists, with just five subjects. Honestly, this is much more optimistic than I expected, and though I’ve seen consumer grade tests with as few as 7 subjects, I feel like this might be due to me using inappropriate effect sizes or the wrong statistical test. There’s a lot to be said about interesting ways to analyze time series and electrophysiological data like EEG, so there is almost certainly a better way to formulate a hypothesis about the effects of binaural beats that fits with a much more appropriate statistical test. Some of them probably rely less on sample size and would be easier to carry out - one of the weaknesses of null hypothesis statistical tests is their reliance on sample size.
If you’re interested in doing more with the R pwr package, I suggest you start with the very brief materials from the [Open Science Framework][5] and read this [overview of power analysis in R.][6] Each uses a slightly different definition of effect size, so it’ll help you answer the question of which is most appropriate for you, and keep in mind that it’s inextricably linked to how your hypothesis is formulated. Heck, OSF offers free statistical and methodological consulting for experiments and projects. Maybe you can buzz them and see if they’d help you out if you have specific questions.
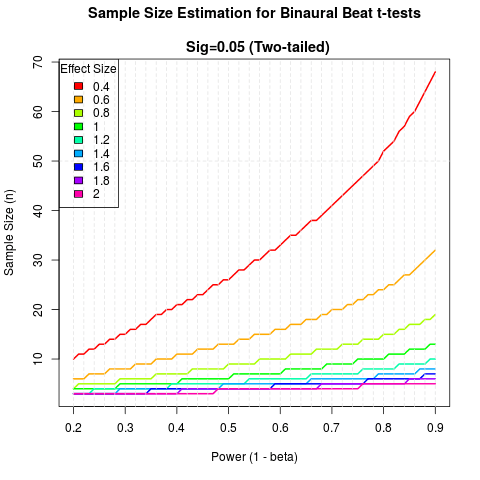
As a cherry on top, I’ve gone ahead and made this little graph. It shows statistical power on the x-axis, and each line represents a different effect size. It’ll give you an idea of how many samples you need for a given effect size and desired power. The long and short of it is that, if the effect is > 1, you probably don’t need more than 10 subjects to get a well-powered study. Any less than that, and you probably need 1-3 dozen depending on the actual effect size. It’s not much, but at least it’ll help you plan a bit. You can find the code for making the plot here: Shows the distribution of power v. sample size for several effect sizes with a two-sided paired t-test · GitHub
Let me know if there’s any other way I can help. -Grant
[1]: http://www.r-project.org/
[2]: https://www.rstudio.com/
[3]: GitHub - IRkernel/IRkernel: R kernel for Jupyter
[4]: http://www.lrdc.pitt.edu/schneider/p2465/Readings/Cohen,%201988%20(Statistical%20Power,%20273-406).pdf
[5]: OSF
[6]: Quick-R: Power Analysis