Here’s a recent paper from UCSD that describes a new technique for visualizing whole-night sleep with just 2 channels of EEG. They collect data from FP1, FP2, A1, A2, but it looks like they can glean plenty of insights just from the difference between FP1 and FP2:
Nice graphs:
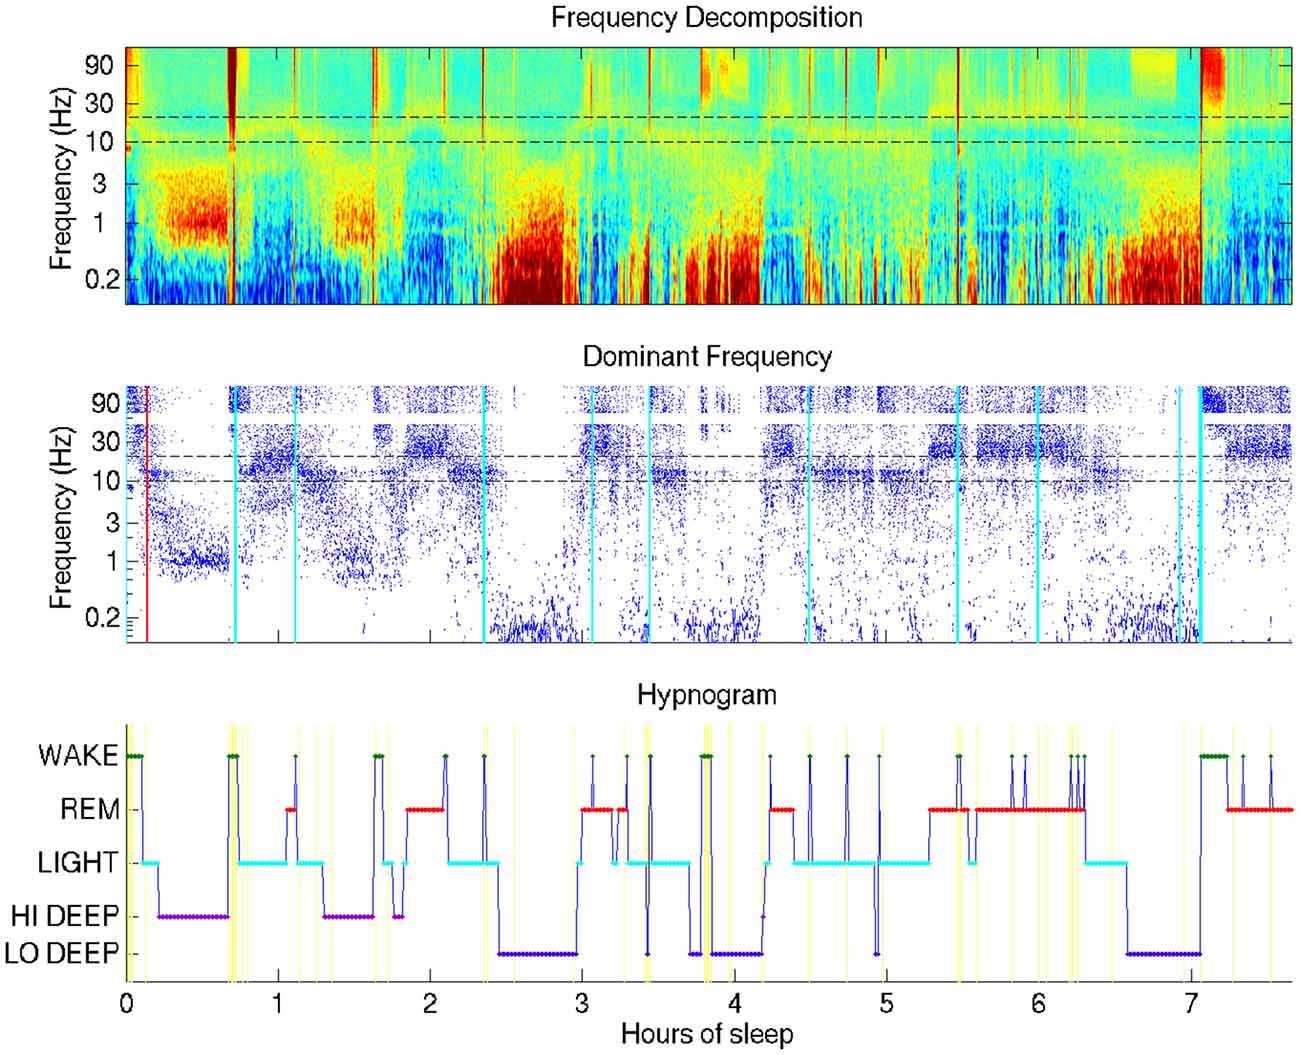
I’m guessing it won’t be too long before we can generate graphs like these from lower-cost headband-style EEG devices. Good stuff.
3 Likes
Very nice paper.
This is the concrete demonstration that spectral analysis can be more detailed than a temporal one in sleep studies and, at the same time, can offer a privileged way to make experiments in a low-cost scenario.
The most interesting point of the paper is the new classification proposed by the authors regarding the slow-waves sleep; exploring deltas under 1Hz in a spectral way, using the dominant frequency approach described, they found two different patterns that increase our psychophysiological knowledge on deep sleep.
The authors have classified everything under 1Hz (0.1 to 1Hz) as “Lo-deep” and the remain part of the delta spectrum (1-4Hz) as “Hi-deep” sleep, founding an interesting association of the first one with electrodermal activity.
From what I know, this is the first study that clearly shows that a qualitative and quantitative differentiation in deep sleep could be hypothesised in terms of 2 distinct sub-stages, since literature generally never or rarely took into consideration <1Hz phenomena on sleep.
Again: very very nice paper!
4 Likes