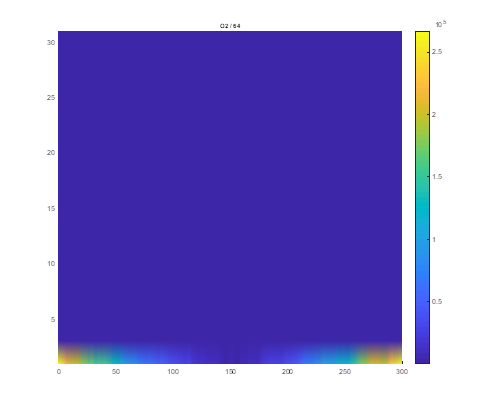
Hello, I am trying to conduct a time frequency analysis but it is producing the attached plot.
I am not filtering the data at 3Hz, and its not just 0s about 3 Hz but very small values. Has anyone had this before and know what is likely to be causing the issue? I am new to the analysis so probably making an obvious mistake.
I see a symmetric spectrum on your picture. That is a normal property of FFT but you do not need both.
Focus this picture on the range 0 - 50 Hz.
For more information, you can contact me.
For others with this problem
If you use some fft function you will get:
your fft in first half and its mirror image in second (if your brain is not working with complex numbers ), that’s one usual problem
in first place an overall leak of signal ‘similar’ to it’s whole power - that means that if you want to compare your results with that of some scientific origin or medical eeg you need to shift from where you are counting your HZ
raw results without nice log that would made them nicer to human eye
I don’t know if you did that but its also helpful to band pass your signal or some programs for visualisation could have a bad day.
 ), that’s one usual problem